Shortcuts and options
This sections describes some functionnalities of the Cairn GUI.
How to use shortcuts in Cairn?
The following table gives the shortcuts that can be used in Cairn.
Action |
Shortcut |
|
|---|---|---|
0 |
Change color of a carrier |
Ctrl + Double click (on the carrier icon) |
1 |
Generate HTML interactive report |
Ctrl + P |
2 |
Load input time series |
Ctrl + T |
3 |
Load project |
Ctrl + L |
4 |
New project |
Ctrl + N |
5 |
Open Users manual |
Ctrl + H |
6 |
Quit |
Ctrl + Q |
7 |
Save |
Ctrl + S |
8 |
Save as |
Shift + Ctrl + S |
9 |
Restore backup |
Ctrl + Z |
10 |
Horizontal scroll wheel |
Scroll wheel |
11 |
Vertical scroll wheel |
Shift + scroll wheel |
12 |
Zoom in or out |
Ctrl + Scroll wheel |
Default ports
Every component comes with a set of default ports. As shown in Fig. 46, the border of a default port is in a bold black color, while the border of a non-default port is in a light gray color.
A default port of a component cannot be removed, and must has a carrier (an EnergyVector) even if it is not connected.
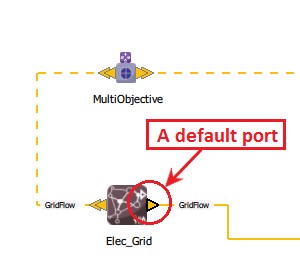
Fig. 46 Default port border
Note
Bus components are an exception. Indeed, technically, a Bus component doesn’t have essential ports. A Bus port is a “mirror” of the connected component port.
How to change the size of a component?
Select the component.
Now it is surrounded by a colored frame and each corner of this frame can be used to increase or decrease the size of the component.
Fig. 47 Increase the size of a component
Display the components to be sized
After setting up the architecture, the user can display marks on the components to be sized (optimized) by clicking the dedicated button on the Toolbar as shown in Fig. 48.
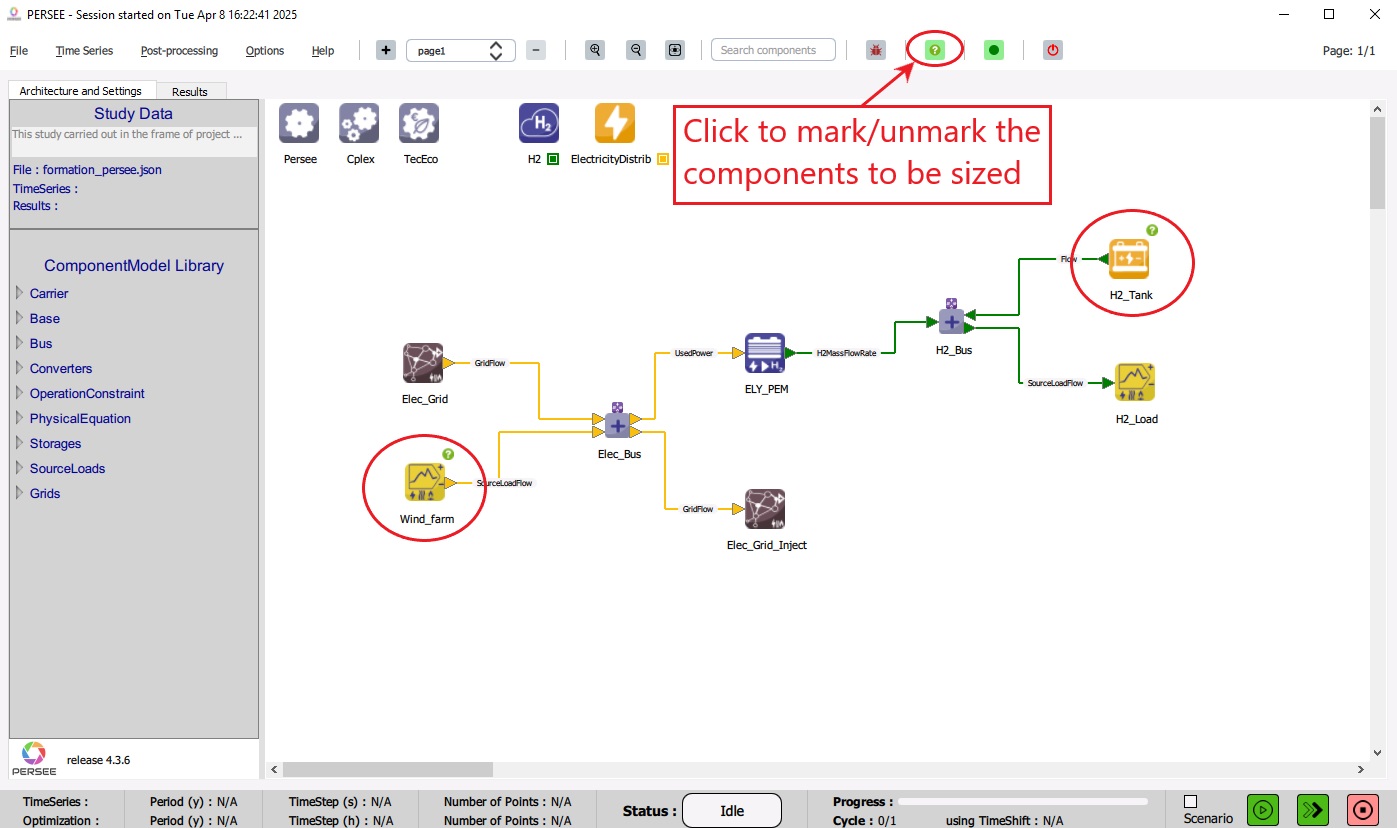
Fig. 48 Display marks on the components to be sized
When the button is clicked, a question-mark icon is displayed on the top-right side of every componenet to be sized, for examples, a SourceLoad whose Weight is negative and a StorgeGen whose MaxEsto is negative. When the button is clicked again the marks are removed.
The marks are displayed when the color of the button is green, and they are hidden when the color of the button is red.
Show/Hide MultiObjective components
The user can show/hide MultiObjective components (and their links) by clicking the dedicated button on the Toolbar as shown in Fig. 49 and Fig. 50.
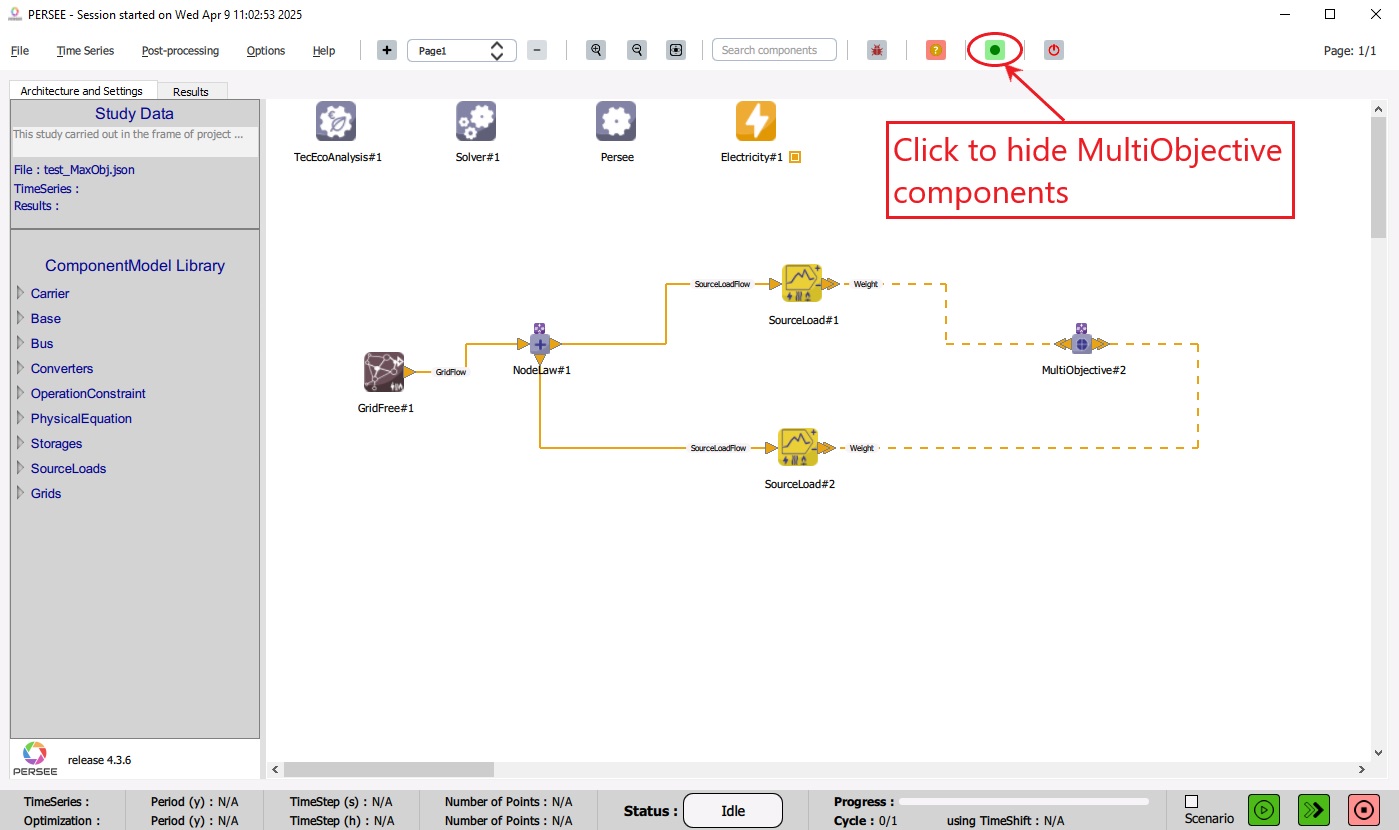
Fig. 49 Hide MultiObjective components and their links
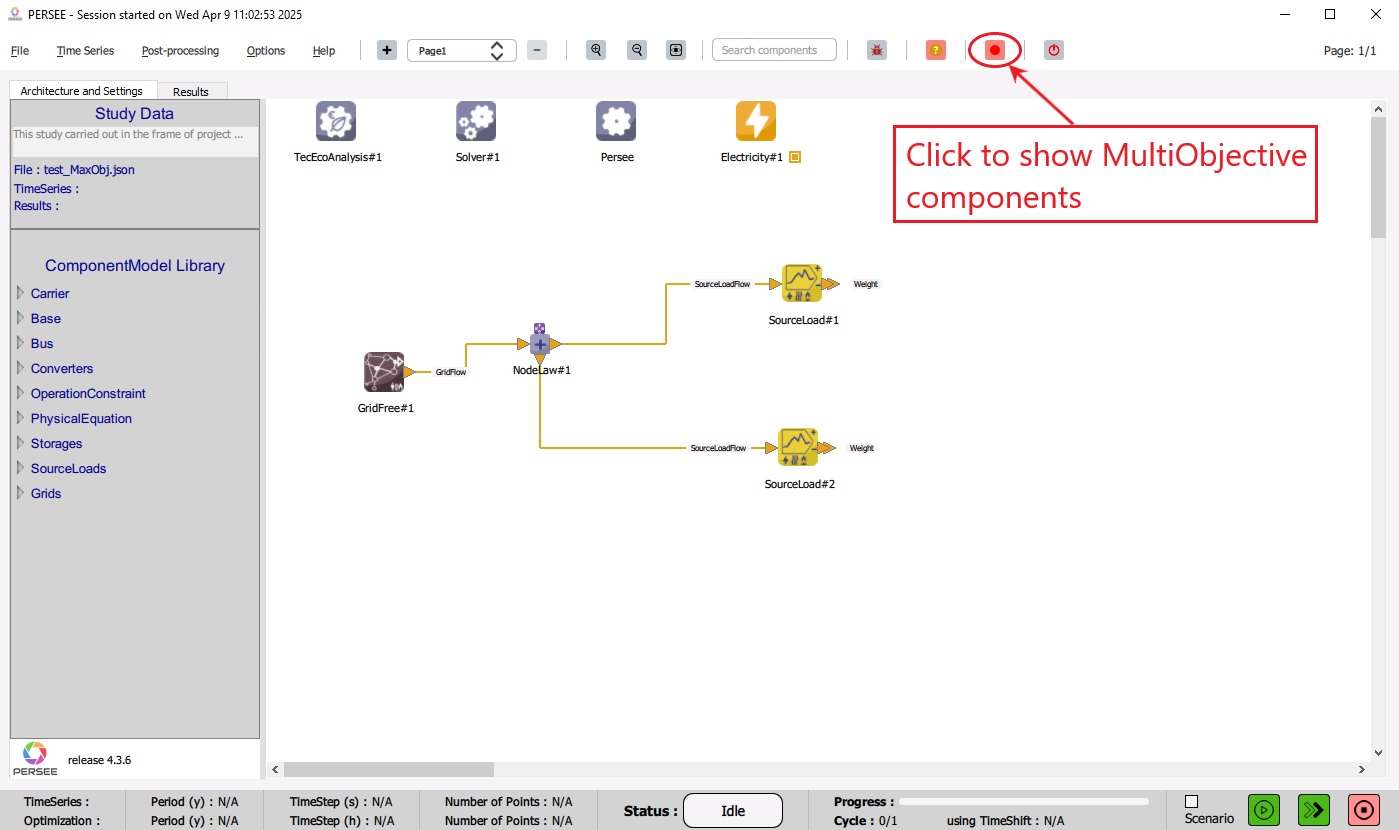
Fig. 50 Show MultiObjective components and their links
The MultiObjective components are shown when the color of the button is green, and they are hidden when the color of the button is red.
Note
Hiding the MultiObjective components doesn’t modify the study and doesn’t affect the result of the simulation. It is only a feature to display the architecture without the MultiObjective connections.
Display the map
Cairn has a feature to display the study architecture on a map. The map can be shown/hidden by clicking the dedicated button on the Toolbar as shown in Fig. 51.
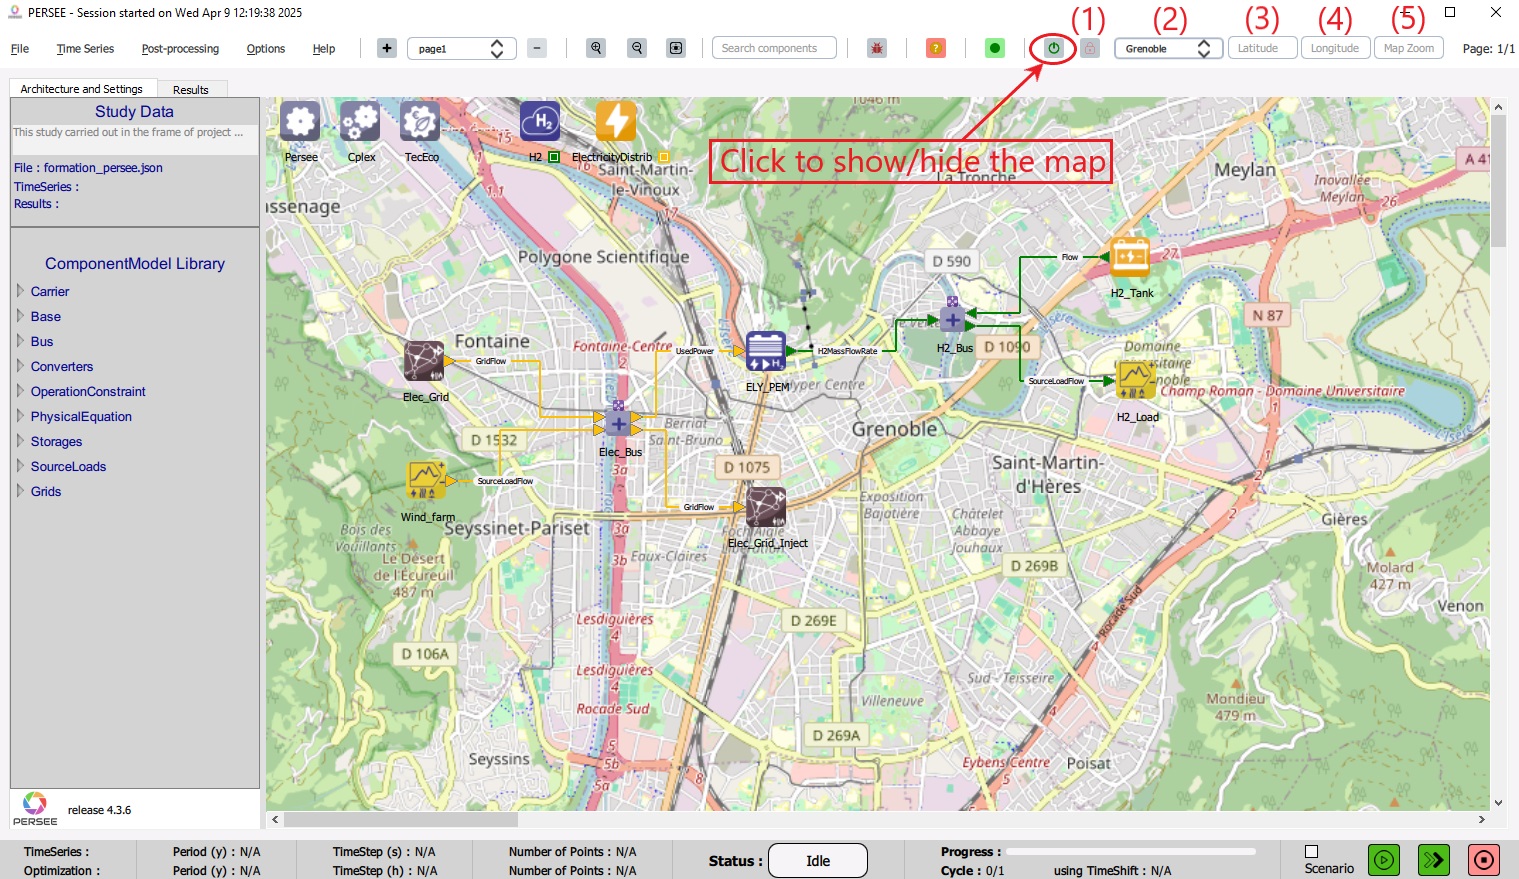
Fig. 51 Display the map
When the map is activated (the color of the button is green), a map-related section on the Toolbar appears. This provides a set of tools to control the map :
Lock button: when it is unlocked (the color is green), the map can be dragged under the study by clicking anywhere on the map then swiping.
Locations List: a drop-down list of pre-defined locations from where the user can choose a location.
Latitude: a text field where the user can input a certain latitude to go to it.
Longitude: a text field where the user can input a certain longitude to go to it.
Map Zoom: a text field where the user can input a certain map zoom.
Note
The Map Zoom is an attribute of the map. Modifying the zoom affects the map area to be displayed. It is not a feature to zoom inside the displayed map area. The default zoom is 13.5.
Note
Writting in the text fields Latitude, Longitude, and Map Zoom takes effect only after pressing the Enter key. The user can write in one field or more then press the Enter key once inside any field.